Ferguson. Baltimore. Louisville. Minneapolis. Deadly police-civilian encounters over the past decade in these and other U.S. cities have launched presidential task forces and sparked protests, riots, and in some cases, retaliatory violence against officers (e.g., Dallas). Yet shockingly, there still isn’t a comprehensive, official dataset that tracks the use of deadly force by police officers. The absence of such a dataset seems absurd, given the widespread ability to track other information like current employment statistics or when a package will arrive at the recipient’s doorstep. The absence of such a dataset makes it too easy for people with large platforms to spread misinformation about police use of deadly force. Finally, the absence of such a dataset diminishes trust in the police and hinders law enforcement’s ability to identify patterns and strive to make police-civilian encounters safer for both officers and civilians.
However, while no official dataset exists, several unofficial databases have been created in the past decade by journalists, advocacy groups, and curious civilians. These datasets are routinely analyzed by academic researchers and cited (sometimes exploited) by journalists, activists, and politicians. While the existence of more comprehensive data is a refreshing change from what existed just 10 years ago, it has presented some new challenges.
The Challenges
The three most popular unofficial datasets—Fatal Encounters, Mapping Police Violence, and Fatal Force (maintained by the Washington Post)—each have different inclusion criteria (see Table 1). Fatal Encounters has the most liberal inclusion criteria. Any time a person dies in the presence of an officer and is mentioned by local news media, the incident is entered into the Fatal Encounters dataset. This includes, for example, suspects who commit suicide in the presence of police officers as well as the 19 children who were killed in the Uvalde massacre.1 Mapping Police Violence is slightly more conservative—it does not include deaths caused by non-police officers, but it does include, for example, deaths caused by off-duty officers not acting in their capacity as police officers (e.g., off-duty cops who have committed domestic murder-suicide).2 Finally, for its Fatal Force dataset, the Washington Post uses the most conservative inclusion criteria by tracking only fatal shootings of civilians by on-duty police officers. This avoids some of the subjectivity surrounding what ultimately caused a person’s death or what the officer’s intent was, but it comes at the expense of failing to capture notable police killings that didn’t involve shooting, such as Eric Garner, Freddie Gray, or George Floyd.
| Table 1. Inclusion criteria for three unofficial datasets tracking police involvement in civilian deaths. | |
|---|---|
| Dataset | Incidents Included |
| Fatal Encounters | “deaths that happen when police are present or that are caused by police: on-duty, off-duty, criminal, line-of-duty, local, federal, intentional, accidental–all of them”3 |
| Mapping Police Violence | “[cases] where a person dies as a result of being shot, beaten, restrained, intentionally hit by a police vehicle, pepper sprayed, tasered, or otherwise harmed by police officers, whether on-duty or off-duty”4 |
| Fatal Force (by Washington Post) | “incidents in which a police officer, in the line of duty, shoots and kills a civilian”5 |
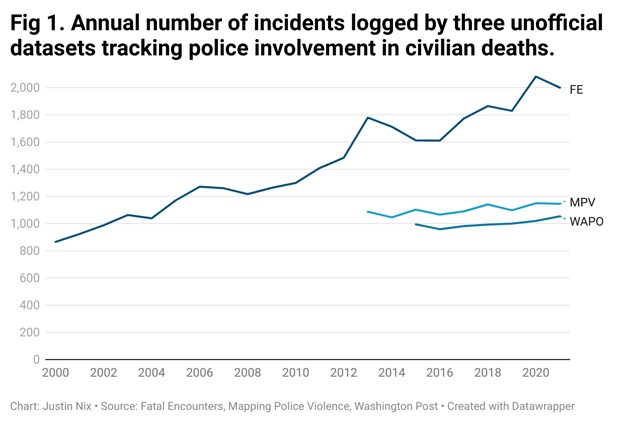
This variance in criteria is problematic because each dataset can produce wildly different answers to the same basic questions (e.g., “How many people are killed by police each year?” or “Are police killing more or fewer people now than they were five years ago?”). Consider Figure 1, which shows the total number of incidents appearing in each dataset each year through 2021.6 Fatal Encounters logged 1,998 incidents in 2021, compared with 1,145 by Mapping Police Violence and 1,053 by the Washington Post. Given the different inclusion criteria identified in Table 1, these differences should come as no surprise. However, one study has shown that the three datasets even disagree on how many on-duty, fatal officer-involved shootings occur each month.7 Fatal Encounters also suggests a significant upward trend in incidents since 2015, whereas the other two datasets show no such trend.
Likewise, subtle differences in what each dataset captures and how details like whether the decedent was armed or unarmed are determined tend to get lost in high-level summaries or media coverage of the latest peer-reviewed study. For example, one highly publicized study published in 2018 in a medical journal analyzed Mapping Police Violence data and purported to show that police killings of unarmed Black men subsequently diminish the mental health of Black people residing in the same state.8 Yet, a separate analysis of the same data revealed as many as 91 potentially misclassified incidents (e.g., suspects and passengers who crashed and died while fleeing traffic stops, inmates who died in correctional facilities after fighting with other inmates or guards, and suspects who had replica firearms). That analysis failed to replicate the original study’s key finding upon recoding the arguably misclassified incidents.9

Equally problematic is that none of the aforementioned datasets currently capture nonfatal officer-involved shootings, which despite not resulting in death, constitute uses of deadly force. This creates a glaring hole in society’s collective knowledge concerning police use of deadly force, as recent studies suggest that nationally, nonfatal officer-involved shootings occur nearly as often as fatal officer-involved shootings.
For example, in its investigation of fatal and nonfatal shootings by 156 police departments from 2015 to 2020, the Washington Post uncovered 2,137 fatal officer-involved shootings and another 1,609 officer-involved shootings that resulted in nonfatal injuries.10 Thus, the Washington Post’s Fatal Force database is missing at least 43 percent of the deadly force incidents these agencies were involved in over that six-year period. It is undoubtedly more than that, since the Washington Post did not collect information on police shootings that did not result in injury or death. However, a Texas Tribune investigation of police shootings in the 36 largest cities in Texas from 2010 to 2015 revealed that among 656 officer-involved shooting incidents, 38 percent were fatal, 36 percent caused nonfatal injuries, 23 percent resulted in no injuries, and 3 percent resulted in suicide or details were unclear.11
The absence of comprehensive data should greatly temper the conclusions drawn about police use of deadly force from these unofficial datasets. It’s like trying to assemble a puzzle with only a nonrandom sample of one-third of the pieces, then trying to surmise the full picture.
What’s the Solution?
There are three paths forward. The first is to maintain the status quo and continue living with these challenges. To their credit, some agencies have simply begun sharing their data publicly on their websites. Kudos to those departments, but this ultimately will not provide the field with an official, comprehensive dataset that provides a bird’s eye view of police use of deadly force and allows for the identification of the conditions associated with higher or lower rates of deadly force.
The second option is for states to take more initiative in this realm. In recent years, a handful of states have legislatively mandated better data collection from their police departments.12 For example, in Texas, from 2015 to 2019, police officers fatally shot 396 people and wounded another 356. Meanwhile, in California, from 2016 to 2019, police officers fatally shot 549 people and wounded 440 more.13 If two of the largest and most populous U.S. states can get this done, others can too, assuming there is political will (and funding).
 The third path is to get serious about reporting to the FBI. Better participation in the FBI’s revamped Use-of-Force Data Program, launched in 2019, would address most of the concerns raised above. It aims to collect information on the following types of incidents:
- When a civilian death occurs in connection with use of force by a police officer,
- When there is serious bodily injury to a person in connection with use of force by a police officer, and
- When a firearm is discharged by a police officer at or in the direction of a person.14
Unfortunately, in 2022, just 9,712 of 18,514 federal, state, local, and tribal law enforcement agencies sent their data to the FBI.15 Agencies that are not currently participating should aim to begin doing so immediately. And the federal government must do more to enhance participation. At a minimum, this means making funding and technical assistance available to the local agencies that need it to get on board.
Deadly force data has advanced significantly over the past decade. Yet, there remains much work to be done in order to develop a more holistic understanding of deadly force. Such an understanding is critical for American policing in the 21st Century. d
Notes:
1Fatal Encounters, “I’m not surprised this isn’t getting more action. It’s unironically the rationale behind U.S. gun laws and qualified immunity. We have 1,467 children in the dataset.” Twitter post, May 26, 2022, 1:43 p.m.
2Elsewhere , the author has taken issue with the broad use of the term “police violence” in the context of data tracking. See Justin Nix, “On the Challenges Associated with the Study of Police Use of Deadly Force in the United States: A Response to Schwartz & Jahn,” PLOS ONE 15, no. 7 (2020): e0236158.
3See D. Brian Burghart, June 18, 2020, update, Fatal Encounters (website).
4See Mapping Police Violence, “About the Data.”
5Fatal Force Database (The Washington Post’s database on police-involved shooting fatalities).
6Data accessed on December 14, 2022.
7Benjamin P. Comer and Jason R. Ingram, “Comparing Fatal Encounters, Mapping Police Violence, and Washington Post Fatal Police Shooting Data from 2015–2019: A Research Note,” Criminal Justice Review 48, no. 2 (2023): 249–261.
8Jacob Bor et al., “Police Killings and Their Spillover Effects on the Mental Health of Black Americans: A Population-Based, Quasi-Experimental Study,” The Lancet 392, no. 10144 (July 2018): 302–310.
9Justin Nix and M.J. Lozada, “Police Killings of Unarmed Black Americans: A Reassessment of Community Mental Health Spillover Effects,” Police Practice and Research 22, no. 3 (2021): 1330–1339.
10See Brian Howey, Wesley Lowery, and Steven Rich, “The Unseen Toll of Nonfatal Police Shootings,” Washington Post, October 21, 2022.
11See “Unholstered: When Texas Police Pull the Trigger,” Texas Tribune.
12See, e.g., John A. Shjarback, “State-Mandated Transparency: A Discussion and Examination of Deadly Force Data among Law Enforcement Agencies in Texas,” Journal of Crime and Justice 42, no. 1 (2019): 3-17.
13Justin Nix and John A. Shjarback, “Factors Associated with Police Shooting Mortality: A Focus on Race and a Plea for More Comprehensive Data,” PLOS ONE 16, no. 11 (2021): e0259024.
14See FBI, “FBI Releases 2019 Participation Data for the National Use-of-Force Data Collection,” press release, July 27, 2020.
15FBI, Crime Data Explorer, Use-of-Force, “Participation” (data cited as of December 15, 2022).
Please cite as
Justin Nix, “Making Sense of Unofficial Deadly Force Data,” Police Chief Online, April 21, 2023.


